Our Mission:
To factually inform my community about our impact on the environment and our efforts toward its conservation.

Topic #1
Wildfires

Lately, it seems as though wildfires are popping up everywhere and that it is way worse than before. However, according to this data from the National Interagency Fire Center, the amount of fires this year is about average compared to the last 10 years. These two graphs show the total acres of Wildfires for each year in the United States and Texas. In 2020, Texas had almost 7,000 wildfires, the second most in the U.S.
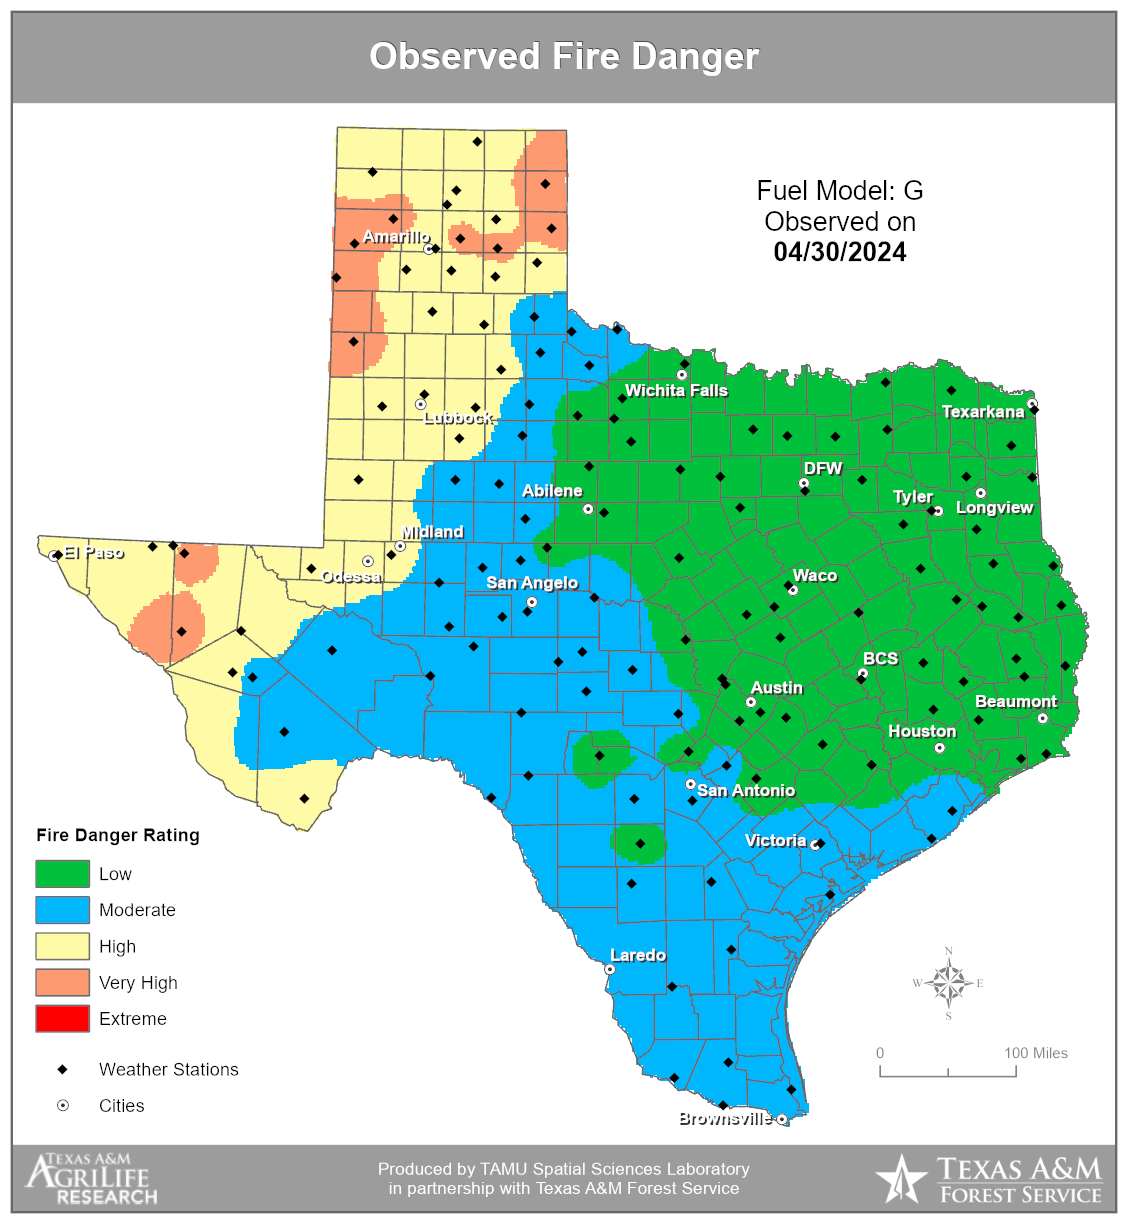
In Texas, it is common for counties to enforce burn bans to minimize the risk of wildfires. Central Texas gets very dry in the summers and regularly has fires. This graph shows the counties that are in danger.
Topic #2
Average Recycling per Person every Year
423lb
per person in the U.S.
993lbs
per person in Texas
355lbs
per person in North Texas

Recycling Facts
Currently, our landfills are filled with materials that should be recycled or reused. For example, 20% of landfills are made up of yard trimmings, 18% is compostable paper, and 18% is recyclable paper.
Topic #3
Carbon Emissions
At the national level, the total annual Carbon Emissions for the U.S. is 5,222 million tons. The top five sources are transportation, electricity, industry, commercial & residential, and agriculture.
As of 2018, the total annual Carbon Emissions for the state of Texas was 684 million tons. Transportation, industry, and electricity were the leading sources.
The total annual Carbon Emissions for the City of Dallas was about 20 million tons. About half was used on electricity and water utilities.
Topic #4
Cars
When it comes to greenhouse gas emissions, one of the most significant contributors to this is transportation. The City of Dallas has reported that about 40% of city vehicles are hybrids or use alternate fuels. By making this effort, the city has made a significant step towards cutting emissions.
Currently, according to the US Energy Information Administration, only about 10.9% of light-duty vehicle(ex. cars, vans, pickups, SUVs) sales are hybrid or electric fueled in the US. However, this is still an enormous improvement from 2014, in which about 3.5% of light-duty vehicles were hybrid or electric fueled. The recent gas prices might also create a surge in hybrid and electric car sales. An interesting fact is that cars made up most of the electric/hybrid car sales up to 2020, but now, electric/hybrid crossover sales have overtaken the electric/hybrid car sales


Topic #5
Air Quality
12.3 μg/m³
of PM2.5 in Dallas, TX
13.7 μg/m³
of PM2.5 in Irving, TX
12.7 μg/m³
of PM2.5 in Los Angeles, CA
PM2.5, a major contributor to air pollution, can be used to gauge air quality. The World Health Organization recommends that the exposure to PM2.5 be less than 10μg/m³. As shown above, as of 2019, these cities do not reach this goal and must focus on bringing these numbers down. PM2.5 is tiny particulate matter that is released in combustion. Sources include fires and vehicle exhaust. PM2.5 mainly affects human respiration. Yet, as of 2020, Dallas’s PM2.5 levels have dipped to 9.6μg/m³, which is under the recommended amount by the World Health Organization. However, this change is the result of COVID-19 and is most likely a temporary change. It can be expected for the PM2.5 levels to return to usual higher levels after the quarantining ends.

Sources:
Recycling
https://environmenttexas.org/reports/txe/state-recycling-texas
Wildfires
https://tfsweb.tamu.edu/DailyFireDanger/
https://tfsweb.tamu.edu/CurrentSituation/
https://www.nifc.gov/fire-information/statistics/wildfires
Carbon Emissions
https://www.epa.gov/ghgemissions/inventory-us-greenhouse-gas-emissions-and-sinks
http://greendallas.net/wp-content/uploads/2016/01/DALLAS-GHG-Emissions-Summary-2010.pdf
Cars
https://www.dallasecodev.org/326/Environment
https://www.eia.gov/todayinenergy/detail.php?id=51218
Air Quality
